
This week, I cover the types of data and figures that we generate for growers, what kind of potential pathogens have been seen in a grower’s hydroponic system, and how similar are the microbiomes of samples from four growers. You will get to see a little bit of data from the Healthy Hydroponics! All data presented are anonymized to protect the privacy of growers.
If you come across a word you are not familiar with in this most, try looking it up in our Microbiology Glossary for Growers. If it’s not there, let us know and we can add it to the glossary.
Samples and types of data
Nutrient solution, leachate, and root samples were collected by Canadian growers (mostly Ontario) and sent to us for DNA extraction, amplicon sequencing, and data analysis. We generate a microbiome report customized to the grower’s hydroponic system detailing the microbiome composition of bacteria, archaea, and eukaryotes (including fungi) in the three types of samples. This report also shows the change in the potential pathogens’ relative abundance (greater than 1%) over time as well as a list of all the potential pathogens detected. Lastly, we generate a Healthy Hydroponic Health Score estimating how healthy the microbiome of nutrient solution, leachate, and root samples are based on the type and the relative abundance of the potential pathogens detected.
Putative* bacterial pathogens in nutrient, leachate and roots
One of the types of figures we provide growers in their report is a line plot showing the abundance of putative pathogens detected over time. Putative pathogens occurring at greater than 1% at any given sampling time point are displayed in a line plot but we provide a list and abundance of all putative pathogens detected including the ones detected at less than 1%. Figure 1 shows the putative bacterial and archaeal pathogens detected over a growth cycle in a lettuce grower’s nutrient solution, leachate, and root samples. The proportion on the vertical axis is out of one e.g. 0.01 is equal to 1%. The horizontal axis represents days in the growth cycle where eighteen days is around the time of harvest.
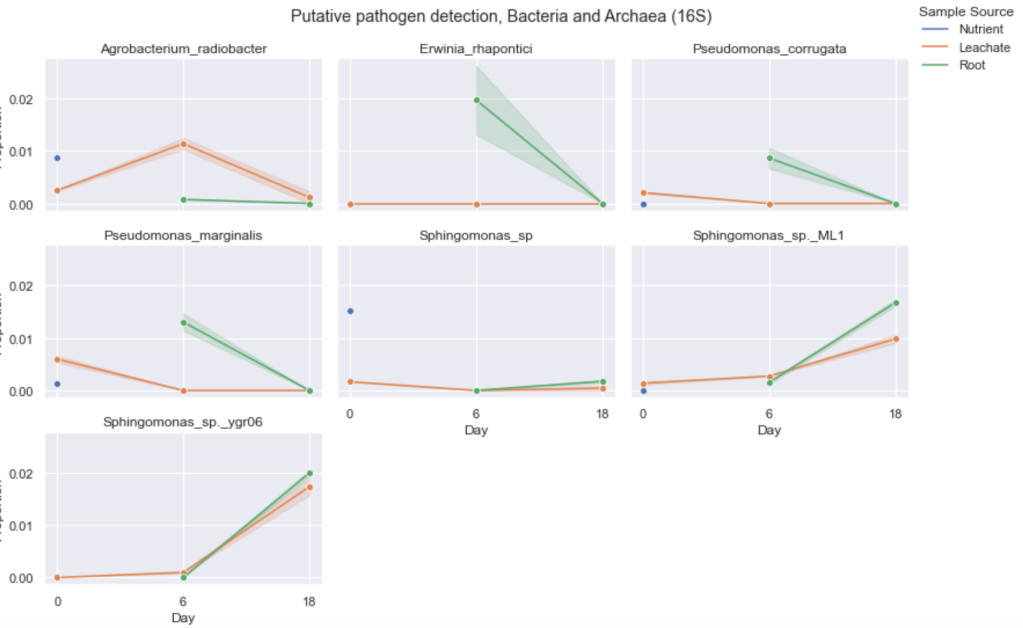
Figure 1. Putative bacterial and archaeal pathogen detection over a growth cycle in a lettuce grower’s nutrient solution, leachate, and root samples. Lines represent the average between two samples and shadings (error bands) corresponding to the confidence interval of the two samples. The nutrient sample was taken only at the first time point. For this grower’s hydroponic system, we only sampled nutrient solution once which is why there is only one point of each putative pathogen at day 0. For leachate and root samples, we see several putative pathogens occur at relatively low abundance (max. 0.02).
Agrobacterium radiobacter, Erwinia rhapontici, Pseudomonas corrugata, Pseudomonas marginalis, and several species of Sphingomonas were detected at greater than 1% in at least one time point. Agrobacterium radiobacter (also known as Agrobacterium tumefaciens) notoriously causes crown gall diseases in plants but is not usually a problem in lettuce.Erwinia rhapontici is known to cause rotting of onion bulbs, cucumber, and crown rot of rhubarb but has not been documented to cause disease in lettuce (1). Pseudomonas corrugata is known to cause pith necrosis of greenhouse tomatoes (2) and hasn’t been reported to infect lettuce.
The genus, Sphingomonas, a common soil and rhizosphere bacterium, have been detected from lettuce but none of which have been pathogenic. Sphingomonas has been reported to cause bacterial leaf blight in melon (3). Sphingomonas belongs to the same taxonomic family as bacteria that cause corky root (Rhizorhapis, Sphingobium, Sphingopyxis, and Rhizorhabdus) meaning they all are closely related (but distinguishable) yet Sphingomonas has not been found to cause corky root (4, 5). In a study where twenty Rhizorphasis and Sphingomonas-like strains were newly isolated from lettuce roots, none of the Sphingomonas were pathogenic (5). What’s interesting is that plant-colonizing Sphingomonas has been found to confer some protection against disease symptoms and suppress growth of pathogenic Pseudomonas syringae pv. syringae DC3000 on the leaves of Arabidopsis thaliana in a controlled system (6). It is possible that the presence of putative pathogens does not necessarily mean they are harming the plants. Namely in this grower’s case, although pathogens were detected, no symptoms of plant disease were reported by the grower for this crop sampled.
Things to note
It is important to keep in mind several things in general when looking at the line plots:
1) Not all potential pathogens detected may be pathogens of the crop being sampled but they are putative plant pathogens.*
2) The relative abundance of the potential pathogen – are they occurring at high enough levels that eventually causes plant disease? Or are they lurking in the system and can multiply when environmental conditions are ideal for them e.g. when the temperature increases to really high levels in the greenhouse during the summer.
3) Samples taken capture a particular snapshot of the microbiome at that time point. This means from one sampling time point to another, the relative abundance of a particular microorganism may not change linearly.
* Explanation on “putative pathogens”: Some members belonging to the same taxonomic group may be so closely related that the genetic sequence that identifies them may be identical. However, some of these members may be pathogenic and some not. Currently, our database does not differentiate between pathogenic or non-pathogenic microorganisms if they share the same marker sequence which is why we are referring to them as “putative pathogens.” We are working on building a database and marker detection system that differentiates between pathogen and non-pathogenic microorganisms of closely-related species. The rich data we are generating in this project with the help of our partner growers will strengthen these efforts.
Comparing samples from different growers
We have also been working on analyzing all of the microbiome data that have been processed from multiple growers. Figure 2 shows a plot (principal components analysis) of samples from four different growers. Each point represents one sample. Points that cluster closer together mean they are more similar to each other. Thus, we can see that the microbiomes of each grower’s samples tend to be more similar to each other than to other growers. Points further away mean they are more dissimilar to each other. These growers have major differences in crops, in some cases types of hydroponic systems, and geographic location. Thus, many factors can contribute to how similar or how different they are to each other in addition to microbiome.
Here we see samples from the same grower tend to cluster with each other meaning the microbiomes of each grower’s samples tend to be more similar to each other than to other growers. Although, we do see samples from all growers congregate in the middle of the plot. There is clustering of nutrient solution samples (triangles) from Growers 1-3 and partially of Grower 4 meaning the microbiomes of the nutrient solution from these growers are very similar, which makes sense because ideally there are few microorganisms in the nutrient solution that feeds the plants unless a microbial inoculant has been added. We see root and leachate samples are somewhat similar to each other which also makes sense in hydroponic systems. What this plot is not showing is the time points of each sample which is something we are working to show with this type of plot.
In this plot, we grouped four different crops. What could be done when we analyze more samples of the same type of crop is to see whether similar crops have similar microbiome profiles, and whether growers growing the same type of crop who are geographically closer together have similar microbiomes in their samples. By doing this composite analysis, we are learning about the diversity of microbiomes in nutrient solution, leachate, and roots of different crops, hydroponic systems, and geographical location over time. We are working on including this type of plot in a follow-up report for growers.
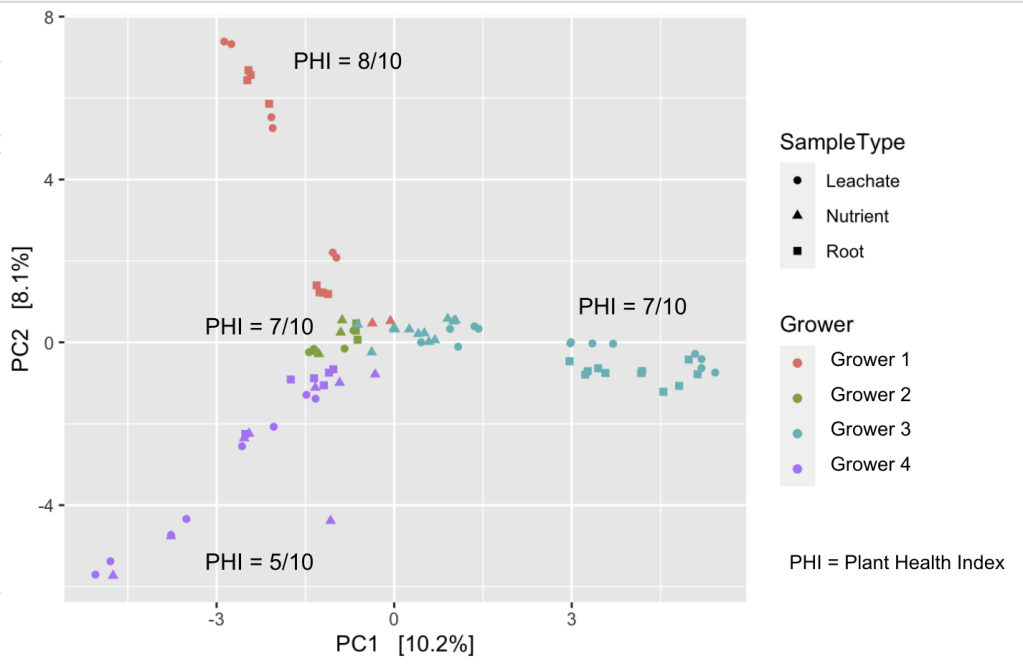
Figure 2. Microbiomes of each grower’s samples (16S rRNA profiles) tend to be more similar to each other than to other growers. Points that cluster closer together mean they are more similar to each other. Points further away mean they are more dissimilar to each other. The Plant Health Index is the same as the Healthy Hydroponic Score.
What’s unique about our process
- Our plant pathogen database is manually curated
- We generate microbiome reports that reflect the sampling plan and operation of the grower
- We provide a Healthy Hydroponic Score for each marker gene (16S rRNA, 18S rRNA and ITS) based on the presence and relative abundance of certain plant pathogens in nutrient solution, leachate, and roots
- We offer meetings with growers upon providing them with the report so that we can go over the format, significant results, and the potential meaning of these results ensuring that growers understand and maximize the benefits of the reports
What growers can take away from the data in a report?
From the first iteration of the report, growers should be aware whether the rise of any pathogens detected coincided with the appearance of plant disease symptoms in their crops. Has crop yield differed from previous growth cycles? If so, we suggest noting down when symptoms were seen and checking the environmental parameters for any fluctuations from optimal at that time point. Sometimes pathogens are detected at low levels in the system for a while before symptoms are seen in plants e.g. Pythium causes root rot but their zoospores can be detected around roots and circulating nutrient solution before symptoms are observed. You can read more about Pythium in our Plant Profile segment.
What are your microbial concerns in hydroponic systems? Are you particularly vigilant about certain plant pathogens? Let us know in the comments!
Works Cited
- Huang, H.C., Hsieh, T.F., and Erickson, R.S. 2003. Biology and epidemiology of Erwinia rhapontici, causal agent of pink seed and crown rot of plants. Plant Pathology Bulletin. (12):69-76.
- Scarlett, C.M., Fletcher, J.T., Roberts, P.,and Lelliott, R.A. 1978. Tomato pith necrosis caused by Pseudomonas corrugata n.sp. Ann. Appl. Biol. (88):105-114.
- Buonaurio R, Stravato VM, Cappelli C, 2001. Brown spot caused by Sphingomonas sp. on yellow Spanish melon fruits in Spain. Plant Pathology. (50): 397-401.
- van Bruggen, H.C., Francis, I.M., and Jochimsen, K.N. 2014. Non-pathogenic rhizosphere bacteria belonging to the genera Rhizorhapis and Sphingobium provide specific control of lettuce corky root disease caused by species of the same bacterial genera. Plant Pathol. (63): 1384-1394.
- Francis, I.M., Jochimsen, K.N., De Vos, P., and van Bruggen, H.C. (2014). Reclassification of rhizosphere bacteria including strains causing corky root of lettuce and proposal of Rhizorhapis suberifaciens gen. nov., comb. nov., Sphingobium mellinum sp. nov., Sphingobium xanthum sp. nov. and Rhizorhabdus argentea gen. nov., sp. nov.Int. J. Syst. Evol. (64): 1340-1350.
- Innerebner, G. Knief, C., Vorholt, J.A. 2011. Protection of Arabidopsis thaliana against leaf-pathogenic Pseudomonas syringae by Sphingomonas strains in a controlled model system. Appl. Environ. Microbiol. 77(10): 202-3210.